Friday, April 8, 2011
Wednesday, March 16, 2011
Silver Copper Replacement Lab? Wait...what?
Fact: Copper wire reacts with aqueous silver nitrate.
Fact: We did a lab about this 5 weeks ago.
Fact: I should not slack on my blog posts.
So obviously we did another lab, the purpose of this one was to demonstrate a replacement reaction, and show us mole ratios in action, in our case we were taking silver nitrate and copper, trading out the silver for copper, and creating copper nitrate and pure silver. We did this by suspending a copper wire in an aqueous solution of silver nitrate and letting it sit for a day, and then observing the reaction. To make the aqueous solution we mixed silver nitrate (AgNO3) with distilled water until it had dissolved. We then placed a coil of copper wire in the solution, covered the tube with wax, and let it sit in the fume hood until day two. During the time we were waiting for the reaction to take place we sat down and did some math. Using the equation 2AgNO3 + Cu ----> Cu(NO3)2 + 2Ag and we formed predictions for how much silver should be formed and how much copper became Cu(NO3)2 in the reaction. I won't bore you with the details but, our predictions said that we should expect to form about .4513g (.0071 mol) of Ag and loose about .2269g (.0036 mol) of Cu in the reaction otherwise known as a 1:2 ratio of replacement. To explain how the experiment works in a more descriptive manner I will refer to one of my lab partners description: <In the experiment, copper changed from its elemental form, Cu, to its blue aqueous ion form, Cu2+(aq). At the same time, silver ions (Ag+(aq)) were removed from solution and deposited on the wire in the elemental Ag metallic form.> On day two we observed that a crystal structure had formed on the copper wire in the tube (fig. 1). Sadly, we had to remove the structure to measure our results. We then emptied the test tube, and filtered the silver particles out of the copper nitrate solution, set the particles and the wire in the fume hood to dry overnight, and disposed of the copper nitrate solution. We are able to tell how much copper was used by measuring the new mass of the wire and comparing it to the mass from before the experiment. On day three we weighed the copper coil and silver nitrate, and then got to work figuring out how much Ag was formed and how much Cu was lost. In other words, more math...
Our predictions said that we should expect to form about .7703g of Ag and loose about .2269g of copper. The first step was changing the predictions we had from grams to mols, when we did this we got .0103 mol.of Ag, and .0036 mol of copper. In other words a 1 to 3 ratio of Cu to Ag. When this information was compared to our predictions (which said we would have a 1 to 2 ratio of Cu to Ag) we got 144% yield of silver and a 100% yield of copper. The inconstancy most likely stems from the paper we weighed our Ag on was still slightly wet and added weight to our readings. All in all, this was a pretty fun lab.
Fact: We did a lab about this 5 weeks ago.
Fact: I should not slack on my blog posts.
So obviously we did another lab, the purpose of this one was to demonstrate a replacement reaction, and show us mole ratios in action, in our case we were taking silver nitrate and copper, trading out the silver for copper, and creating copper nitrate and pure silver. We did this by suspending a copper wire in an aqueous solution of silver nitrate and letting it sit for a day, and then observing the reaction. To make the aqueous solution we mixed silver nitrate (AgNO3) with distilled water until it had dissolved. We then placed a coil of copper wire in the solution, covered the tube with wax, and let it sit in the fume hood until day two. During the time we were waiting for the reaction to take place we sat down and did some math. Using the equation 2AgNO3 + Cu ----> Cu(NO3)2 + 2Ag and we formed predictions for how much silver should be formed and how much copper became Cu(NO3)2 in the reaction. I won't bore you with the details but, our predictions said that we should expect to form about .4513g (.0071 mol) of Ag and loose about .2269g (.0036 mol) of Cu in the reaction otherwise known as a 1:2 ratio of replacement. To explain how the experiment works in a more descriptive manner I will refer to one of my lab partners description: <In the experiment, copper changed from its elemental form, Cu, to its blue aqueous ion form, Cu2+(aq). At the same time, silver ions (Ag+(aq)) were removed from solution and deposited on the wire in the elemental Ag metallic form.> On day two we observed that a crystal structure had formed on the copper wire in the tube (fig. 1). Sadly, we had to remove the structure to measure our results. We then emptied the test tube, and filtered the silver particles out of the copper nitrate solution, set the particles and the wire in the fume hood to dry overnight, and disposed of the copper nitrate solution. We are able to tell how much copper was used by measuring the new mass of the wire and comparing it to the mass from before the experiment. On day three we weighed the copper coil and silver nitrate, and then got to work figuring out how much Ag was formed and how much Cu was lost. In other words, more math...
 |
| (fig.1) |
Intermolecular Forces Lab (With a mix of Data, and Words)
It's time for another blog post!!! It's only been about a month since my last one, so I'm a little ahead of my normal schedule, but this post is a rather good one on Intermolecular Forces (the bonds that hold the elements together). Recently, we did a lab in chemistry where we measured how different chemicals (in this case alkanes) can affect the rate of cooling of a temperature probe in order to understand how molecular weight plays a part in intermolecular forces. Needless to say, the temperature probes and I did not get along very well.
The basic premis of the experiment was to see how much energy was used by the element when it changed from a liquid to a gas, through evaporation in order to determine if molecular weight is a factor in inter molecular forces [in other words, does molecular weight play a part in the amount of energy needed by an element to induce a change of state (liquid to gas)]. We are able to use temperature to determine the amount of energy needed to change the state of matter thanks to the laws of thermodynamics. Since we know that heat flows from the warmer object (the probe) to the cooler substance (the liquid alkanes) until an equilibrium is reached, state changes are determined by the speed of molecules and that the First Law of Thermodynamics states that "Energy cannot be created or destroyed, only changed from on form to another" then we can correctly assume that the liquid alkanes (having been cooled to below zero in order to liquidize) will take the energy (in the form of heat) from the temperature probe until they evaporate (that energy is used to make the molecules move faster, which changes state), the amount of energy (in the form of heat, measured by temperature) used by the substance to change states is then visible as the amount of energy lost by the temperature probe.
In order to determine this we were to two stick temperature probes (fig. 1) into a pair test tubes each containing the liquid form of one of six different alkanes (Ethanol, Methanol, Propanol, Butanol, Pentane, and Hexane) let the probes sit in the tube for 30 seconds to determine their starting temperature, then remove the probe and tape it to the edge of the desk and measure the decrease in temperature over the course of 5 minutes. After recording the results of all six substances in "Logger Pro" we then found the change in temperature for each substance by subtracting the lowest temperature reached from the starting temperature. I then plotted the decrease in temperature (y-axis) vs. the molecular weight (x-axis) for each element on a graph in order to see if there was a correlation between the molecular weight, and the amount of energy needed to change the state of the substance.
| (Fig. 1) |

Now, above you can see my afore mentioned graph of the results of the lab. The first thing that you can see is that there is a very obvious correlation between the molecular weight, and the amount of energy used to change the state of matter. With the first four liquids (represented with boxes, I'll talk about why the circles are different in a moment) you can see that as the molecular weight gets bigger, the amount of energy needed needed to change state is lower. This is because as length of hydrocarbon chains increase (Ethanol has 1, Methanol 2, Propanol 3, and Butanol 4) the strength of the hydrogen bonds holding them together decreases, which makes it easier for the liquids to evaporate. Now, the reason that Pentane and hexane are not following the downward trend set by the other four substances is that they are not held together by a weak hydrogen bond (they can't hold more than 4 hydrocarbon chains together) they are held together by a stronger bond that requires more energy to break, but like the hydrogen bond, gets weaker with the each new set of hydrocarbon chains which would make the pattern repeat its self.
So in conclusion, this lab was very useful in demonstrating a number of things. First, it shows how molecular weight affects the bonds within the element, which affect its evaporation time. It also helped demonstrate how some of the laws of thermodynamics work, especially how heat flows from one place to another. And lastly, it proved that temperature probes hate me (spending 15 mins trying to figure out which probe is which was wa to long..)
Friday, January 28, 2011
Mol's, Equations, and Popcorn....Oh My!
Before I get into the chemistry aspect of this post, let me begin with (quite possibly) the most important statement of this entire post: I love popcorn. Over the past 2(?) weeks since school started back up, we've been talking about some pretty interesting stuff, more specifically, mol's and how they relate to the measurement of reactants and products. (In other words, its time for a hypothetical discussion)
602,000,000,000,000,000,000,000-And why it matters
*Warning: Hypothetical Discussion Follows*
Lets say you work for a big chemical company (ie: DOW) and you need to mix up a batch of Sodium Benzoate (Na C6 H5 CO2) the first problem that you will encounter is how to you ensure that you get the proper ratio of atoms in the mixture. In a normal recipe one would typically use a cup of this ingredient and a teaspoon of another to gain that ratio. In chemistry though the ratios are specific to the number of molecules needed to complete the reaction. One unit of Sodium Benzoate contains one Na atom, 6 Carbon atoms, 5 hydrogen, and one molecule of CO2. Sadly you can't just measure out on atom of sodium to throw into the mix, so a old dead scientist (Jean Perrin) through a series of complicated math, came up with Avagadro's (attributed to Amedeo Avagadro) number. Avagadros number is approximately 6.02*10^23 or 602,000,000,000,000,000,000,000. What this number ends up meaning is that there are 602,000,000,000,000,000,000,000 atoms of the element in every mol of that element. Now the weight of a mol for each element is different (due to density and other fancy factors) but easily found on any periodic table. The atomic weight of an element is the weight of one mol of that element. Therefore when you mix up a batch of Sodium Benzoate you will mix 1 mol of sodium (22.990g), 6 mol's of Carbon (12.001g per mol), 5 mol's of Hydrogen (1.0097g per mol) and 1 mol of CO2 (44.009g). When you mix all of this together, due to the Law of Conversation of Mass, the total weight of the final mixture should be 144.0535g. Thereby allowing you to correctly calculate the amount of product needed to produce "X" grams of the solution, solving the second problem you would encounter: How much product do I need to purchase to produce the final chemical. By solving that issue you allow the people in accounting to allocate the funds needed to buy the products and by doing this they can calculate the price that they will charge for the final product, which ultimately means....YOU GET PAID (If you don't get why thats important...I would like to take a moment to welcome you to Earth!) And thats why 602,000,000,000,000,000,000,000 (six-hundred and two million billion, for the record) is important.*Warning: Hypothetical Discussion Follows*
Equations: Why They Exist, and Why I Hate them
| Welcome to Chem 111 |
Unfortunately for the non-mathmatically inclined, Chemistry involves equations. Today, these equations will involve going from precent of composition, Mass to Mol's and writing chemical equations. Equations like these are rather useful in chemistry. They can help you determine basically everything you could ever want to know about a mixture. In the above hypothetical situation, we use an equation to determine the ratio of grams of elements. To do this you determine the atomic weight of every element of the equation, multiply those numbers by the number of mol's needed of each element. To determine the ratio of the elements you divide each of the numbers by the smallest. This creates a gram to gram (is that a real term?) ratio. Which eventually tells you that for every gram of element X that you have you need to add 5 grams of element Y for the correct reaction. Another way that equations are used in chemistry is to determine what a solution is (by way of empirical formulas) based on the percent composition of elements. Take the percent composition of 10.04% Carbon, 0.84% Hydrogen, and 89.12% Chlorine. To determine the empirical formula we are first going to assume that we have a 100g sample of the substance. By assuming this it makes it very easy to determine the grams (10.04% of 100g = 10.04g.) Once you have the number of grams of each element you divide the grams by the molecular weight of the element, which gives you the number of moles of each element. This division gives you .846 mol of Carbon, .832 mol of Hydrogen, and 2.51 mol of Chlorine. The next step is to divide each of the number of mols by the smallest number of mols (.832 mol's of H) which will give you the (approximate(error of margin is always an issue to those super picky chem teachers)) ratio of elements. In this case the ratio is 1C : 1H : 3Cl, which translates into a molecular formula of CHCl3, otherwise known as Chloromethane or Methyl Chloride.
Originally I planned to include data from the recent popcorn experiment we did, but since we just finished another much more interesting experiment I will put a post about that sometime soon, especially since I have a video of it! So, until then, in the words of Spock, "Live Long & Prosper."
Originally I planned to include data from the recent popcorn experiment we did, but since we just finished another much more interesting experiment I will put a post about that sometime soon, especially since I have a video of it! So, until then, in the words of Spock, "Live Long & Prosper."
Thursday, December 9, 2010
Part 2 of the 3 Epic Post
Part 2. The Conductivity Lab (with the ghetto testers)
About a month and a half ago we did a lab called the "Conductivity Lab". Whoooooo! Very exciting right? Well kinda.....
Background Information
The point of this lab was to further explore the ionization abilities of certain substances. The theory behind the lab was that different ions will gain or lose an electron to become stable. Take sodium for example (btw thank you Katrina for the idea...from your blog) has an electron configuration of 1s22s22p6s1. What this means is Sodium has one valiance electron. What this means is that often sodium (a metal) looses that electron to another element (a non-metal) in a ionic bond.
This happens because elements bond to become stable, when Sodium loses that electron it becomes stable with an electron configuration like neon. This "electron sharing" makes it a pseudo-noble gas with the stable configuration of 1s22s22p6.
[An ionic bond is a type of chemical bond that involves a metal and a nonmetal ion (or polyatomic ions such as ammonium) that bond through electrostatic attraction. Simply put, it is a bond formed by the attraction between two oppositely charged ions.
The metal donates one or more electrons, forming a positively charged ion (cation) with a stable electron configuration. These electrons then enter the non metal, causing it to form a negatively charged ion (anion) which also has a stable electron configuration. The electrostatic attraction between the oppositely charged ions causes them to come together and form a bond.]
This happens because elements bond to become stable, when Sodium loses that electron it becomes stable with an electron configuration like neon. This "electron sharing" makes it a pseudo-noble gas with the stable configuration of 1s22s22p6.
The Lab. Finally.
For the lab we mixed (dissolved) eight different substances into distilled water. The solution that was produced by the mixing was then tested by two different instruments. First the "ghetto tester". It was basically a battery hooked to a LED connected with two bare wires for insertion into the solution, which would complete the circuit if it conducts electricity (thanks to the amazing ions). If the solution is ionic (conducts electricity and completes the circuit) then the LED will light up. Sadly it won't give you a precise reading of the conductivity...
| Ghetto..... |
Which is why we have a second way of testing. This other type of conductivity tester we used was the USB connected "conductivity probe". This probe used essentially the same type of circuit as the other tester (using the solution to complete the electrical circuit) with the only difference being that the LED was replaced by a voltameter. The computer uses the data from the voltameter to, using a complex equation, compute the conductivity of the substance.
| Probe |
Below is the data table of results collected from the experiment, followed by a comparative graph of the different solutions conductivity.

 |
Conductivity Results The Graph^ So I made a graph about the data. It is quite beautiful. (Ok the font choices could've been better but...oh well) What the graph demonstrates is the relationship between different element's and their electroconductivity. The Y axis of the graph shows the electroconductivity of the element, measured in Microsemens per square centimeter (Yes I realize the intervals are screwy, the program I made it on is stupid) . The X axis shows the elements names. What we can learn from this graph is, Citric Acid has the highest electroconductivity (249.3 mS/cm2), and sugar water has the lowest with 16.1 mS/cm2. Sugar has a lower conductivity because sugar (glucose) is held together with a covalent bond (which is "crap for ions"), whereas Citric Acid is held together with an ionic bond which makes for amazing ions. Ions are key to conductivity because the shared electrons are able to move around. When you add electricity (a bunch of electrons) the electrons are able to jump from the negative terminal to an atom, and then from atom to atom, eventually returning to the positive terminal (of the power source) creating an electrical current. Conclusion In conclusion, an elements electron configurations determines if If an element has electrons to lose/give away (to become stable), then that element will conduct electricity, because electricity is conducted by electrons (names make sense now don't they?) passing from atom to atom, resulting in an electric current. |
Monday, December 6, 2010
My Epic 3 Part Post (Don't Forget COMMUNITY STANDARD!!!)
So these last few weeks I have been feeling quite lazy, the result of an epic 7 page post in Biology, show week, Math Day, Harry Potter 7, and 3 hours of Jazz Band rehearsal this morning. But, I figured I had better'd make a blog post on The Periodic table, The Conductivity Lab and an Article Review. Yawn, so here we go.......
PART 1. The Periodic Table. It has periods. And patterns.
 |
| Nicholas Mendeleev |
The second thing that he did differently was he occasionally ignored the order that atomic weights would suggest and switch adjacent elements like Cobalt and Nickel to group them better based on chemical properties. Eventually it would become apparent that he had (unknowingly, as atomic structure theories were still in the works) arranged the elements in order based on Atomic Number. Even later on, with the development of Quantum Mechanical Theories, it becomes apparent that each row of the table relates to the filling of the quantum shells of atoms.
 |
| Mendeleev's Known Table |
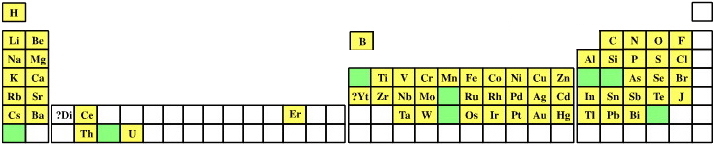 |
| Mendeleev's Predicted Table |
 |
| Modern Table |
Groups:
Groups (or families) are are vertical columns in the periodic table and also the most important way of classifying the elements. In groups 1A-8A (Main Group Elements) the elements in the columns share certain properties (Number of valence electrons, atomic radius, etc...) all the way down the group. Each group has a trivial name ie: 1A is the Alkali Metals, 2A is the Alkaline Earth Metals, 3A the Boron Group, 4A is the Carbon group, 5A the Pnictogens, 6A the Chalcogens, 7A the Halogens, and 8A The noble gasses. In groups 3B-2B (the Transition Metals) groups are named by the uppermost element in the group. In the "A" groups the groups number is equal to the number of electrons in the valence electrons.
Periods:
Periods are the horizontal rows of elements. The only places in the table where periods are more important for classification than groups are the d-block (transition metals, groups 3B-2B) and the f-block (inner-transition elements, lanthanides and actinides). The main use for periods is determining the number of electron shells for each block. Modern quantum mechanics explains these periodic trends in properties in terms of electron shells. As atomic number increases, shells fill with electrons in approximately the order shown below. The filling of each shell corresponds to a row in the table.
- 1s (Groups 1A and 8A, Period One (hydrogen and helium))
- 2s (Groups 1A and 2A, Period 2 (Li,Be)) 2p (Groups 3A-8A, Period 2 (B,Ne))
- 3s 3p 3d
- 4s 4p 4d 4f
- 5s 5p 5d 5f
- 6s 6p 6d
- 7s 7p
- 8s
Blocks:
A block is a set of adjacent groups. The block names (s, p, d, f. and g) are derived from the quality of the spectroscopic lines of the associated atomic orbitals: sharp, principal, diffuse and fundamental, the rest being named in alphabetical order. Blocks are sometimes called families.The s-block is comprised of groups 1A-2A, the p-block is comprised of 3A-8A, the d-block is comprised of groups 3B-2B, the f-block is comprised of the lanthanides and actinides, the g-block is hypothetically comprised of the predicted 8th period.
Now there are some other ways of grouping elements (platinum group, noble metals, etc...), but no one really cares about those, mostly because they're are not really used in high school chemistry. So to end this first part of my 2nd quarter post I'll leave you with another image of the periodic table labeled with some of the things I've discussed. Phew.

Tuesday, October 5, 2010
I can see the LIGHT!!!! but its bouncing off my eyeballs....
Its a wave, its a particle, no.......its LIGHT!!!!!!!! (or a unicorn if you're Niki)
So if you hadn't guessed it already this post is going to be all about Light! Yay!!!! This week in Chem we did a Spectra lab. I other words we looked at different light sources (Some of the sources being low pressure tubes filled with a gas like Nitrogen or Helium that had an electric current run through them) through spectrascopes (Cardboard tubes with a special little plastic film on one end, and a tiny slit on the other.....sounds fancier than it really is.) When you look at the light through the spectrascope the little slit limits the amount that passes through the tube into the the plastic. The plastic splits the light in to the different wavelengths (ROYBGIV).
The different light sources emit different wavelengths. When you look at the light through the spectrascope it is possible to determine the element in the light source based on those wave lengths.
In the above picture is a florescent light bulb as viewed through a Spectrascope. Because it emits white light (all wavelengths combined) you can see bands of all the different spectrums present in the picture. Other light sources emit different frequency's of light. The different frequencies of light are caused by the electrons in the element being at different energy levels.
Energy levels:
-Bohrs Model---------Rather than having electrons located at fixed points in side an atom they are located within different energy levels (called orbitals in Bohrs model)
Electrons are located on the blue rings (they are impossible to locate at specific any time) they orbit the nucleus. When you add energy (in the form of electricity) the electrons jump to another level and back to their original level, producing energy in the form of light waves. The black spots are due to the element not being able to make those specific electron jumps. Today rather than orbitals electrons in a particle model are thought to be in electron clouds.
In the cloud model the 1s, 2s, 2p, and 3s orbitals are the different energy levels. In the cloud model Electrons exist in probability densities which take on certain shapes, not orbitals.
The only problem with Bohrs model is that the math only worked for Hydrogen. Because of this people began to think that electron were waves. In other words, each electron also has a wave, (Thanks a lot to Louis Victor de Broglie) which can be calculated by the equation below, where h is the Planck Constant, and p is the momentum:
With this formula you can calculate the wavelength of anything, therefor everything has/is a wave. Now your every day objects like a car have such a small wave length (thanks to that equation) that it is not noticeable (more like an object, less like a wave). But when you get down to the amazingly small objects like an electron the wavelengths become bigger, and noticeable (thanks again to that equation).
So.......In conclusion the wave model is pretty far out there in left field for me (mostly because it a pretty new concept) but, I'm hoping that if I Google stuff repetitively, and ask questions that I should grasp it before the final...hopefully.
So if you hadn't guessed it already this post is going to be all about Light! Yay!!!! This week in Chem we did a Spectra lab. I other words we looked at different light sources (Some of the sources being low pressure tubes filled with a gas like Nitrogen or Helium that had an electric current run through them) through spectrascopes (Cardboard tubes with a special little plastic film on one end, and a tiny slit on the other.....sounds fancier than it really is.) When you look at the light through the spectrascope the little slit limits the amount that passes through the tube into the the plastic. The plastic splits the light in to the different wavelengths (ROYBGIV).
 |
| White light Spectra through Spectrascope |
The different light sources emit different wavelengths. When you look at the light through the spectrascope it is possible to determine the element in the light source based on those wave lengths.
In the above picture is a florescent light bulb as viewed through a Spectrascope. Because it emits white light (all wavelengths combined) you can see bands of all the different spectrums present in the picture. Other light sources emit different frequency's of light. The different frequencies of light are caused by the electrons in the element being at different energy levels.
Energy levels:
-Bohrs Model---------Rather than having electrons located at fixed points in side an atom they are located within different energy levels (called orbitals in Bohrs model)
 |
| Bohrs Model |
 |
| Cloud Model |
The only problem with Bohrs model is that the math only worked for Hydrogen. Because of this people began to think that electron were waves. In other words, each electron also has a wave, (Thanks a lot to Louis Victor de Broglie) which can be calculated by the equation below, where h is the Planck Constant, and p is the momentum:
 |
| Bohr's Caption |
With this formula you can calculate the wavelength of anything, therefor everything has/is a wave. Now your every day objects like a car have such a small wave length (thanks to that equation) that it is not noticeable (more like an object, less like a wave). But when you get down to the amazingly small objects like an electron the wavelengths become bigger, and noticeable (thanks again to that equation).
 |
| The Wave Model |
So.......In conclusion the wave model is pretty far out there in left field for me (mostly because it a pretty new concept) but, I'm hoping that if I Google stuff repetitively, and ask questions that I should grasp it before the final...hopefully.
Subscribe to:
Posts (Atom)